
Having covered the very basics of machine learning (ML) in a previous post, I want to introduce you to an essential conceptual framework embodied in a simple graph called the “learning curve” or “training curve.” This graph can be made to aid evaluation of any ML project, and is invaluable for non-expert evaluation of a project. The learning curve is closely related to cross-validation, which we will also discuss.
Although you will encounter the term cross-validation more often than learning curve, I think a learning curve is a bit easier to understand and much more important. Typical cross-validation really gets you only one point of a learning curve, as we will see.
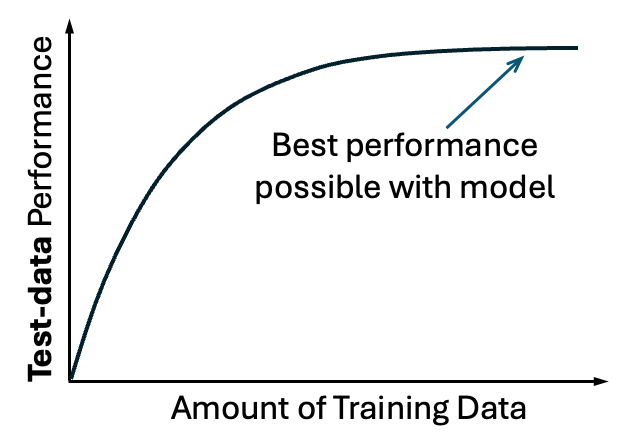
The learning curve simply measures performance of a model as more data is included. Performance can be quantified in different ways, e.g., the correlation between predicted and actual values or mean-squared error. Importantly, as shown above, the learning curve measures performance on test data, i.e., data not used to train the model.
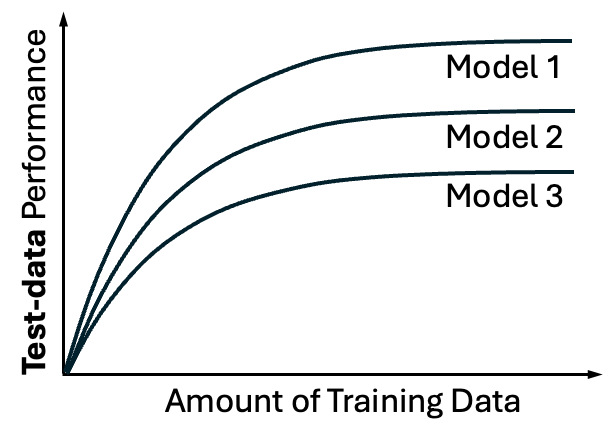
The learning curve typically follows an intuitive shape, steeper at the beginning and then plateauing at some peak level of performance. The peak level of performance is specific to the chosen model (e.g., linear or quadratic), and the peak performance might not be so great if the model is not suitable for the data or the data is very noisy.
In other words, different models will have different learning curves, and the ML practitioner would be well served by examining multiple models. That’s not cheating, it’s doing an optimization (over models) that typically isn’t done automatically in ML software.
We need to try different models, because (i) typically the first model we try won’t be the best one, and (ii) even if it is, we won’t know that until we test other models. Discussion of different model types will be the topic of a future post.
There is an important nuance about optimizing the model or any model parameters for a particular set of test data. Such a process implicitly uses the test data in finding the best model, and thus the test data is actually part of training and does not provide true validation. In such cases, a totally separate set of validation data should be held aside from the beginning for true performance evaluation.
You can ask the experts
With the learning curve in mind, you now have a question you can ask of any ML study author. Put politely, “Did you examine how the model performance varied with the amount of training data?” Or less politely, “Did you check that that you had sufficient data to reach a plateau in performance?”
In my experience, most ML studies do not show learning curves. If you ask about them, you are actually helping the folks doing the ML. After all, maybe the learning curve will show that their model can do even better with more data, lending support for their approach.
Another thing you can think about is information, in a semi-quantitative sense. I don’t mean the mathematical framework “information theory,” but rather the simple question, “Does the data actually contain substantial information about the thing I’m trying to predict?” The answer to this question arguably provides biological/chemical/physical information (depending on the system). For example, we might want to know whether cell images contain easily extractable information about the cell cycle state.
To sharpen our understanding of ML, let’s consider the combined learning curves for both training and test data, shown schematically.
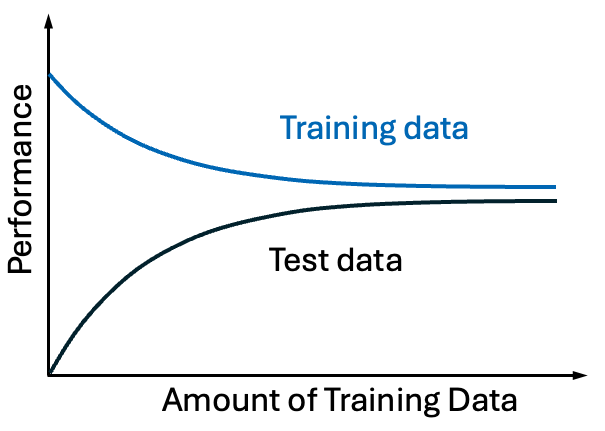
Although the decline in training-data performance may seem surprising at first glance, it makes sense after some thought. Consider a highly simplified case where we want to perform a linear fit with just two data points. Of course we can fit any two points exactly, so the performance will be perfect by any measure. While a linear fit has just two parameters, the slope and intercept, realistic ML models have many parameters which enable them to fit more points exactly. The fit will still be decent as more points are added, but we can expect the performance quality to decline to some limiting value based on the suitability of the model and the amount of noise in the data. With enough training data, the performance should be similar to that of the training data if the two data sets are sufficiently similar.
The connection to cross-validation
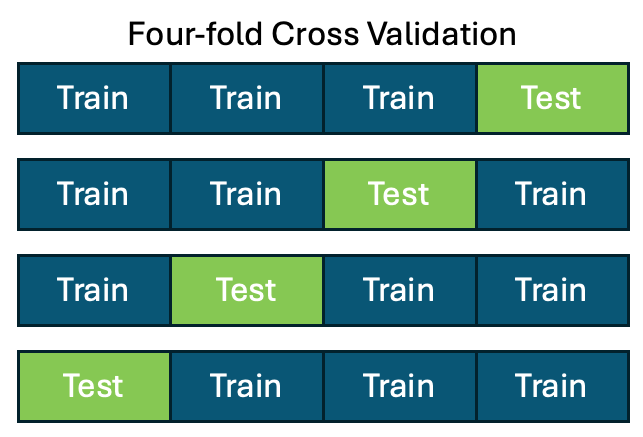
Cross-validation is straightforward. For n-fold cross validation, you divide your data into n chunks and these chunks remain the same during validation. You train your model on n-1 chunks and test on the remaining chunk, repeating this n times leaving out a different chunk each time. Thus, you obtain n different performance estimates.
Cross validation is a very important type of analysis, but we should understand how it fits in to the larger endeavor of ML and learning curves in particular. One valuable aspect of cross validation is that it yields multiple performance values, enabling you to see how repeatable (or variable) your performance assessment is. After all, everything we compute in realistic systems comes with some uncertainty or error in our calculation.
Considered in the setting of the learning curve, we can see that cross-validation with a particular number of chunks or folds, yields just one point of the learning curve (along with an estimate of the performance variability for that point).
Thus, if we only perform cross-validation for one choice of data-chunking, we will have no idea as to where we are on the learning curve, i.e., whether we have reached saturation in performance or not. We will not know whether the model chosen would benefit from more training data.
Relatedly, we can consider leave-one-out (LOO) cross-validation. In LOO, you simply exclude a single data point chosen at random from training, and then make a prediction for that point. Repeating this process as many times as desired leads to both an average performance estimate and the degree of variability. As with simple cross-validation, this leads to just one point on the performance curve, but at least LOO makes maximal use of the data available for training.
To me, the ideal is to compute the full learning curve, using a variation of LOO. I suggest leaving out some randomly chosen fixed amount of the data, repeating this to get a performance value for the amount of retained training data, and then increasing the amount of training data included. This will generate the full learning curve.
Remember, only your learning curve can tell you whether your model will benefit from more training data.